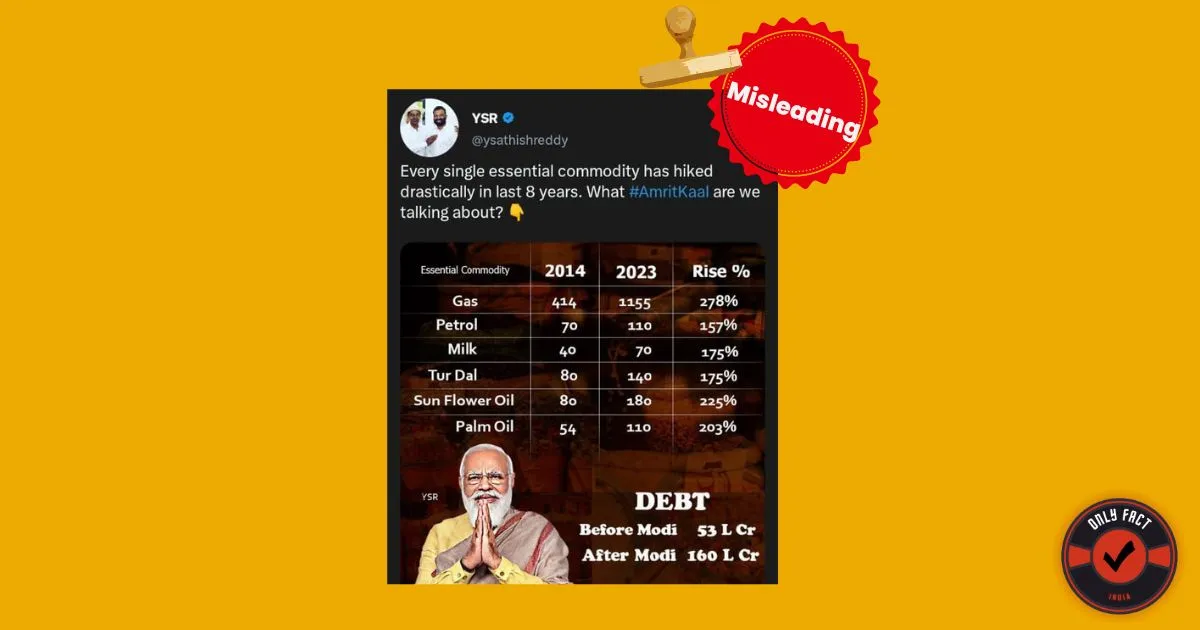
On March 4, 2023, BRS party social media convenor Y Sathish Reddy, also known as YSR, shared an infographic on his Twitter handle. The infographic compared the prices of essential commodities from 2014 to 2023, and the percentage rise in their prices was also shown. Along with the infographic, YSR wrote, “Every single essential commodity has hiked drastically in the last 8 years. What #AmritKaal are we talking about?”
This statement highlights the need for examining the accuracy of the information presented in the infographic.
In this Fact-check article, we will delve into the prices of essential commodities in 2014 and 2023 to verify the claims made by YSR in the infographic.
Also Read: No, Mehani and BJP has no involvement with extremist Amrit Pal
Fact Check
During our investigation, we started to search the prices of all the commodities shown in the shared infographic one by one.
LPG Price
According to The Times of India report, the LPG gas price in 2014 was ₹410. However, the current LPG gas price in Delhi is ₹1103. Now let’s calculate its percentage rise from 2014 to 2023.
Percentage Rise = ((New value – Old value)/ Old value) × 100%
So, after putting in the values, the percentage rise from ₹410 in 2014 to ₹1103 in 2023 is 169% and not 278% as shown in the infographic.
Petrol Price
According to the mycarhelpline report, the price of petrol in 2014 was ₹72.26. However, the current price of petrol in Delhi is ₹96.72.
So, the percentage rise from ₹72.26 in 2014 to ₹96.72 in 2023 is 33.87% and not 157% as shown in the infographic.
Milk Price
According to Government’s Retail Price Query Report, the price of milk in 2014 was ₹50. However, the current price of milk is ₹66.
So, the percentage rise from ₹50 in 2014 to ₹66 in 2023 is 32% and not 175% as shown in the infographic.
Tur Dal Price
According to Government’s Retail Price Query Report, the price of Tur Dal in 2014 was ₹80.50. However, the current price of Tur Dal is ₹140.
So, the percentage rise from ₹80.50 in 2014 to ₹140 in 2023 is 73.8% and not 175% as shown in the infographic.
Sunflower Oil Price
Moreover, the price of sunflower oil in 2014 was ₹80 and now the price of sunflower oil in 2023 is ₹180.
So, the percentage rise from ₹80 in 2014 to ₹180 in 2023 is 125% and not 225% as shown in the infographic.
Palm Oil Price
The price of Palm Oil in 2014 was ₹54 and now the price of Palm Oil in 2023 is ₹110.
So, the percentage rise from ₹54 in 2014 to ₹110 in 2023 is 103.7% and not 203% as shown in the infographic.
Thus, after analyzing the data and the rising percentage presented in the infographic shared by YSR, we found it to be false and misleading. While it is true that the prices of certain essential commodities have risen over the years, the percentage rise presented in the infographic is not accurate.
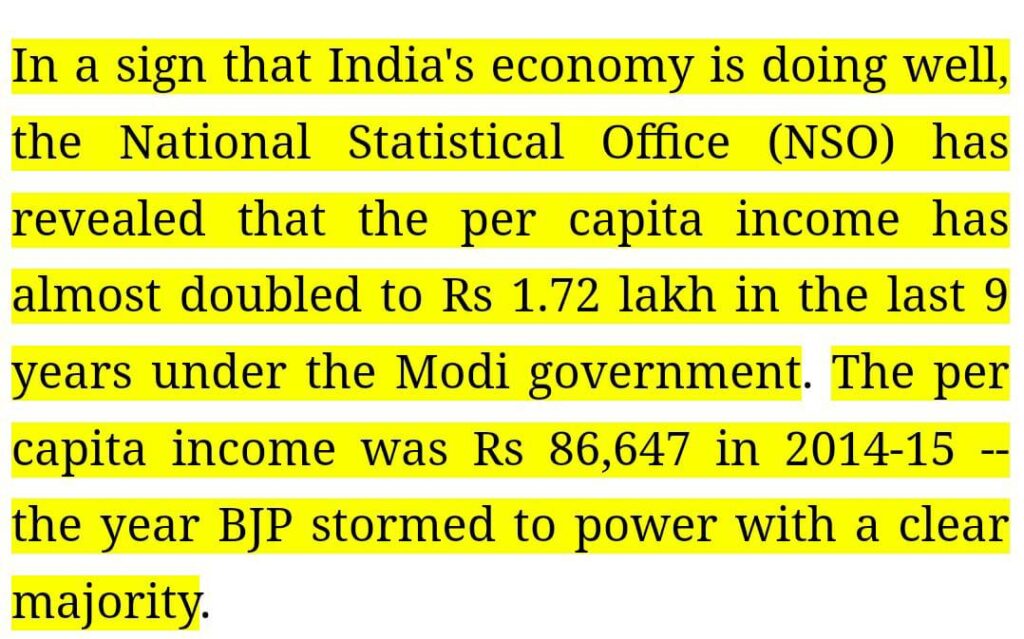
Besides, one more thing that BRS party social media convenor YSR hide or didn’t share in this infographic is India’s per capita income which has increased significantly in PM Modi’s government. India’s per capita income has doubled under the PM Modi Government that is from ₹86,647 in 2014-15 to ₹1.72 lakhs in 2023.
| Claim | Every single essential commodity has hiked drastically in the last 8 years |
| Claimed | BRS party social media convenor Y Sathish Reddy aka YSR |
| Fact Check | Fake and Misleading |
Also Read: Samajwadi party shares 4 year old video of Haryana to blame Yogi govt
The goal of the Only Fact Team is to provide authentic news facts and debunk lies to safeguard readers’ interests.
Dear Readers, we are working to debunk fake news which is against India. We don’t have corporate funding like others. Your small support will help us grow further.
Jai Hind!


